#1775126093
[ chess ]
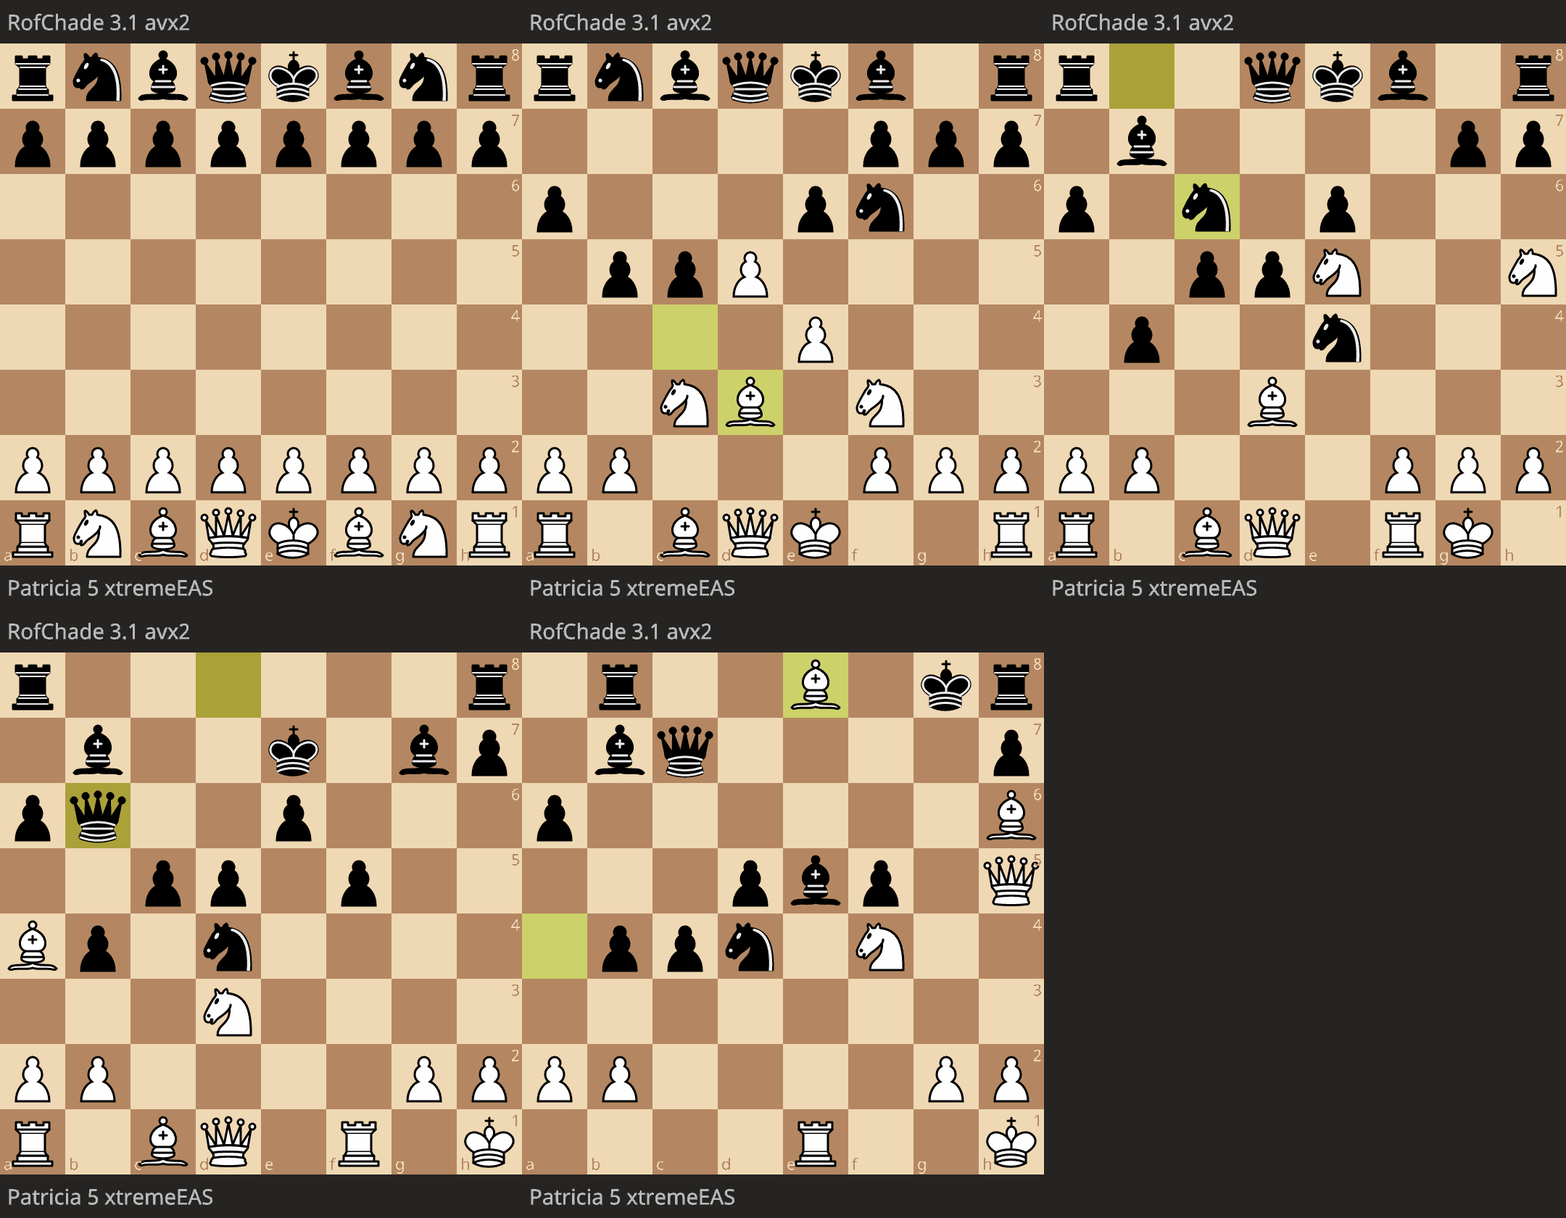
I was looking for interesting chess engines to test and I came across Patricia, the most aggressive chess engine ever seen. It is currently rated 3466 on Stefan Pohl’s website (compared to Stockfish 18’s rating of 3910). It is a very strong engine but probably wont ever be the best. But when it wins, it often does so in a brutal way. Bellow is a game played as part of a tournament against RofChade 3.1 with a respectable elo of 3536 (higher then Patricia but still close). The book stats with equal material with a slight position advantage for white. Patricia starts sacrificing early and doesn’t stop until a final rook sacrifice to start the push for mate. White is behind on material the entire game but still wins.

Engine play starts at move 7